City rivalries come in many forms—who has the best pizza, which sports team dominates. But there is one kind of rivalry that might win out when it comes to making us hot under the collar: Which city has better drivers?
Reputation precedes some of these U.S. cities, whether it be for drivers who are too aggressive, slow, inconsiderate, speedy or just incompetent. But how does each stack up against their neighbor? Are San Diegans justified in changing lanes when they see Arizona plates? Who’s more aggressive than an NYC driver—besides possibly a Philly one?
SIXT wants to help settle this beef for good. In the battle between cities with reputations for grudges against their driver neighbors, which one will come out on top? Using a blend of data including tickets and speed-related incidents, and seat belt and cell phone laws (as well as evidence from expert witnesses), we’re prepared to crown the best drivers from neighboring cities.
Kansas City, KS vs Kansas City, MO
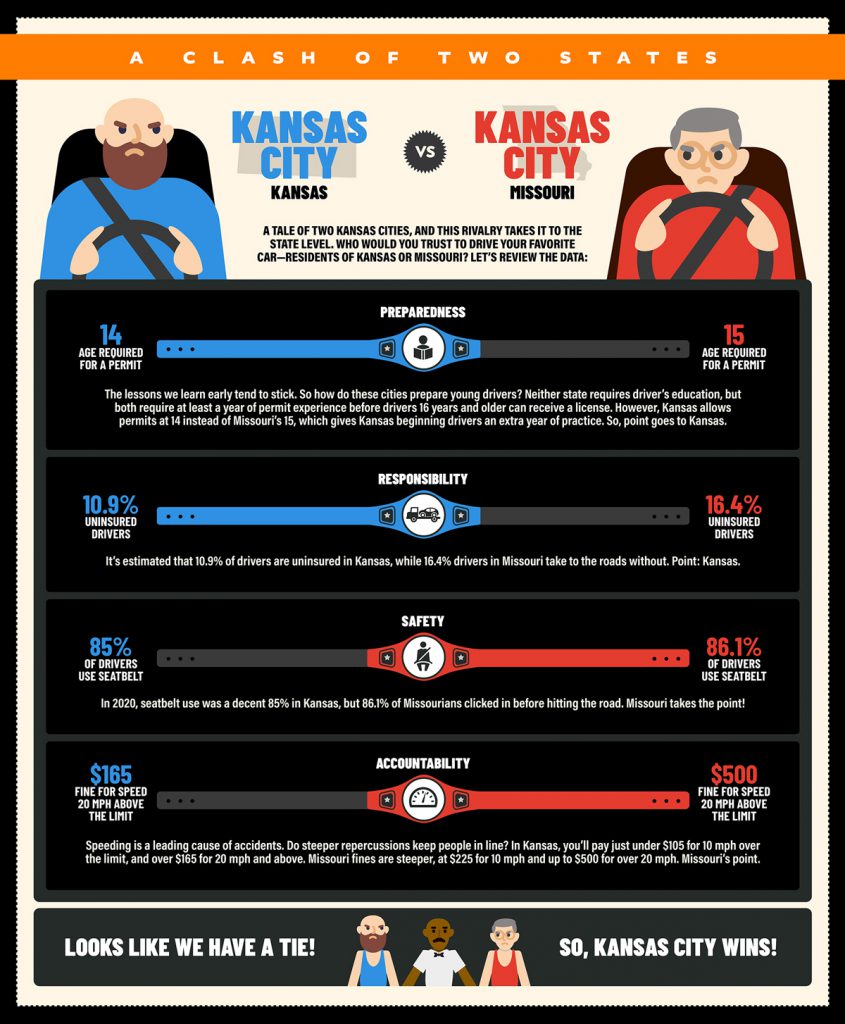
We begin with a tale of two Kansas Cities, and this rivalry takes it to the state level. Who would you trust to drive your favorite car—residents of Kansas or Missouri? According to Johnny Rowlands, KMBC traffic reporter, both sides of the state line share courteous habits. On the Missouri side, he says, “Being known as a nice place to live is a big part of Kansas City pride, and I think showing kindness to other drivers is just an extension of that.” Is one side nicer than the other? Let’s review the data:
Preparedness
The lessons we learn early tend to stick. So how do these cities prepare young drivers? Neither state requires driver’s education, but both require at least 1 year of permit experience before drivers 16 years and older can receive a license. However, Kansas allows permits at the age of 14 compared to Missouri’s 15, which gives Kansas drivers an extra year of practice.
✅ Point: Kansas
Responsibility
It’s estimated that 10.9% of drivers are uninsured in Kansas, while16.4% of drivers in Missouri take to the roads without insurance.
✅ Point: Kansas
Seat belts
In 2020, seat belt use was a decent 85% in Kansas, but 86.1% of Missourians clicked in before hitting the road.
✅ Point: Missouri
Accountability
Speeding is a leading cause of accidents. Do more repercussions keep people in line? In Kansas, you’ll pay just under $105 for going 10 mph over the limit, and over $165 for 20 mph and above. Missouri’s fines are higher, at $225 for 10 mph over the speed limit and up to $500 for over 20 mph.
✅ Point: Missouri
✅ Winner: Looks like we have a tie for good driving. Kansas City it is!
Milwaukee, WI vs Chicago, IL
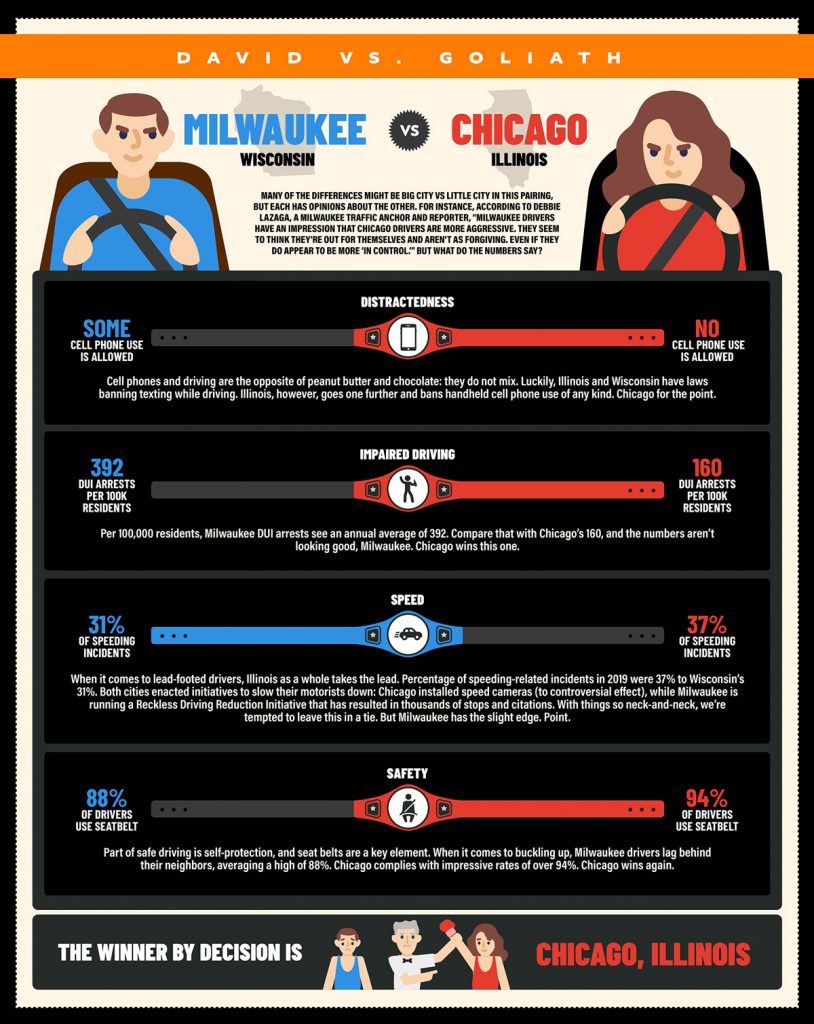
Many of the differences might be big city versus little city in this pairing, but each has opinions about the other. For instance, according to Debbie Lazaga, a Milwaukee traffic anchor and reporter, “Milwaukee drivers have an impression that Chicago drivers are more aggressive. They seem to think they’re out for themselves and aren’t as forgiving. Even if they do appear to be more ‘in control.’” But what do the numbers say?
Distracted Driving
Cell phones and driving are the opposite of peanut butter and chocolate: They do not mix. Luckily, Illinois and Wisconsin have laws banning texting while driving. Illinois, however, goes one step further and bans handheld cell phone use of any kind.
✅ Point: Chicago
Impaired Driving
Milwaukee has an annual average of 392 DUI arrests per 100,000 residents. Compare that with Chicago’s 160 per 100,000, and the numbers aren’t looking good, Milwaukee.
✅ Point: Chicago
Speed
When it comes to lead-footed drivers, Illinois as a whole takes the lead. The percentage of speeding-related incidents in 2019 were 37% to Wisconsin’s 31%. Both cities enacted initiatives to slow their motorists down: Chicago installed speed cameras (with some controversy), while Milwaukee is running a Reckless Driving Reduction Initiative that has resulted in thousands of stops and citations. With things so neck-and-neck, we’re tempted to leave this in a tie. But…
✅ Point: Milwaukee has a slight edge
Seat belts
Part of safe driving is self-protection, and seat belts are a key element. When it comes to buckling up, Milwaukee drivers lag behind their neighbors to the south, averaging 88% of people using seat belts. Chicago complies with impressive rates of over 94%.
✅ Point: Chicago
✅ Winner: Chicago has the best drivers!
Phoenix, AZ vs San Diego, CA
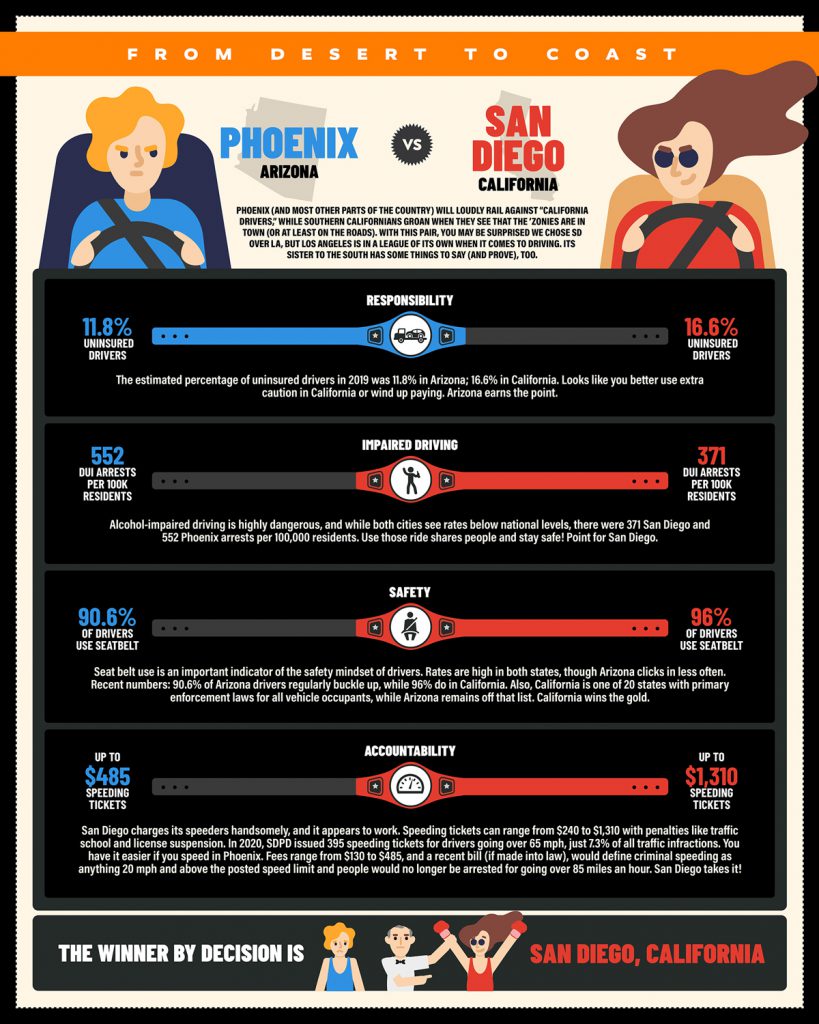
Phoenix (and most other parts of the country) will loudly rail against “California drivers,” while Southern Californians groan when they see that the ’Zonies are in town (or at least on the roads). With this pair, you may be surprised we chose San Diego over Los Angeles, but LA’s drivers are in a league of their own. Its sister city to the south has some things to say (and prove), too.
Responsibility
The estimated percentage of uninsured drivers in 2019 was 11.8% in Arizona and 16.6% in California. Looks like you better use extra caution in California or wind up paying.
✅ Point: Phoenix
Impaired driving
Alcohol-impaired driving is highly dangerous, and while both cities see rates below national levels, San Diego had 371 arrests per 100,000 people, while Phoenix had 552 per 100,000. Use those ride-sharing options and stay safe!
✅ Point: San Diego
Seat belts
Seat belt use is an important indicator of the safety mindset of drivers. Rates are high in both states, though Arizona clicks in less often. According to recent data, 90.6% of Arizona drivers regularly buckle up, while 96% do in California. Also, California is one of 20 states with primary enforcement laws for all vehicle occupants, while Arizona remains off that list.
✅ Point: San Diego
Accountability
San Diego charges its speeding drivers hefty fines, and it appears to work. Speeding tickets can range from $240 to $1,310 with added penalties like traffic school and license suspension. In 2020, SDPD issued 395 speeding tickets for drivers going over 65 mph, just 7.3% of all traffic infractions. You have it easier if you speed in Phoenix. Fees range from $130 to $485, and a recent bill (if made into law), would define criminal speeding as anything 20 mph and above the posted speed limit and people would no longer be arrested for going over 85 miles an hour.
✅ Point: San Diego
✅ Winner: San Diego’s drivers take the lead!
Philadelphia, PA vs New York City, NY
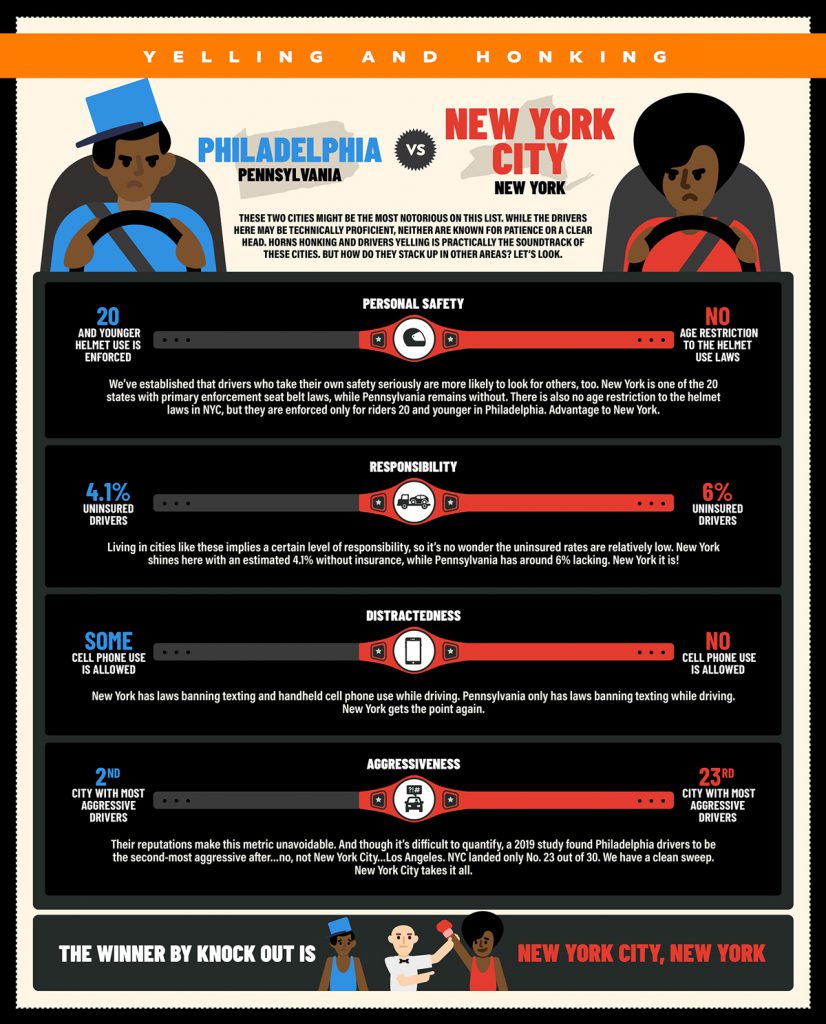
These two cities might be the most notorious on this list. While the drivers here may be technically proficient, neither are known for patience or a clear head. Horns honking and drivers yelling is practically the soundtrack of these cities. But how do they stack up in other areas? Let’s have a look.
Responsibility
Living in cities like these implies a certain level of responsibility, so it’s no wonder the uninsured rates are relatively low. New York shines here with an estimated 4.1% of drivers lacking insurance, while Pennsylvania has around 6% going without insurance.
✅ Point: New York
Personal safety
We’ve established that drivers who take their own safety seriously are more likely to for others, too. New York is one of the 20 states with primary enforcement seat belt laws, while Pennsylvania remains without. There is also no age restriction to the helmet laws in NYC, but they are enforced only for riders 20 and younger in Philadelphia.
✅ Point: New York
Distracted driving
New York has laws banning texting and handheld cell phone use while driving. Pennsylvania only has laws banning texting while driving.
✅ Point: New York
Aggressiveness
Their reputations make this metric unavoidable. And though it’s difficult to quantify, a 2019 study found Philadelphia to have the second most-aggressive drivers. Who came in first? No, not New York City; Los Angeles took the top prize! NYC landed only No. 23 out of 30. We have a clean sweep.
✅ Point: New York City takes it all!
✅ Winner: New York City knows how to drive!
Seattle, WA vs Portland, OR
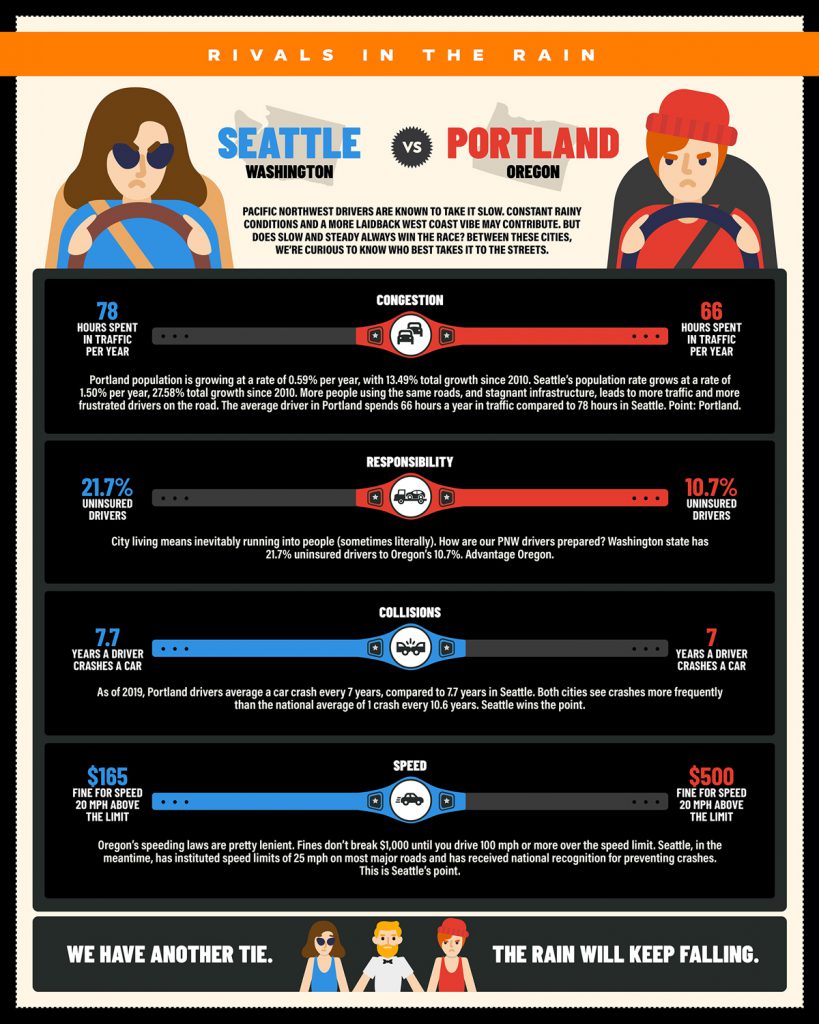
Pacific Northwest drivers are known to take it slow. Constant rainy conditions and a more laidback West Coast vibe may contribute. But does slow and steady always win the race? We’ll break down the good and bad about drivers in Seattle and Portland.
Responsibility
City living means inevitably running into people (sometimes literally). How are our PNW drivers prepared? Washington state has 21.7% uninsured drivers to Oregon’s 10.7%.
✅ Point: Portland
Congestion
Portland’s population is growing at a rate of 0.59% per year, with 13.49% total growth since 2010. Seattle’s population rate grows at a rate of 1.50% per year, with 27.58% total growth since 2010. More people using the same roads, and stagnant infrastructure, leads to more traffic and more frustrated drivers on the road. The average driver in Portland spends 66 hours a year in traffic compared to 78 hours in Seattle.
✅ Point: Portland.
Collisions
As of 2019, Portland drivers average a car crash every 7 years, compared to 7.7 years in Seattle. Both cities see crashes more frequently than the national average of 1 crash every 10.6 years.
✅ Point: Seattle
Speed
Oregon’s speeding laws are pretty lenient. Fines don’t break $1,000 until you drive 100 mph or more over the speed limit. Seattle, in contrast, has instituted speed limits of 25 mph on most major roads and has received national recognition for preventing crashes.
✅ Point: Seattle
✅ Winner: We have another tie! Drivers in Portland and Seattle are equally awesome.
While the debate over which city has the best (or worst) drivers may rage on, we hope this provides some insight. Happy (and safe) driving out there!
Data Sources:
- mytrafficguys.com
- corsolawgroup.com
- nbcsandiego.com
- kcur.org
- data.cityofchicago.org
- traffictickets.com
- city.milwaukee.gov
- wisconsindot.gov
- urbanmilwaukee.com
- wyosnicklegal.com
- data.cityofnewyork.us
- opendataphilly.org
- azcourts.gov
- ilsos.gov
- thedp.com
- crashstats.nhtsa.dot.gov
- insurance-research.org
- drunkdrivingprevention.com